

Project Deep Dive
Insights from the PM

Service Groups and Relationships
As the Lead Product Manager for Azure Resource Manager, I led the strategy, design, and delivery of Azure Service Groups—a major evolution in how Azure organizes and governs cloud resources. This initiative introduced a graph-based relationship model to overcome the limitations of Azure’s hierarchical Management Groups, enabling many-to-many resource connections, dynamic group memberships, and cross-boundary flexibility.
The Challenge
Azure’s native Management Group hierarchy enforced a one-parent-per-subscription tree model. While scalable and simple, this structure proved too rigid for customers with complex organizational, regulatory, or deployment needs. Multiple enterprise customers—including top financial and government clients—requested more expressive ways to organize their cloud assets across teams, services, and environments.
At the same time, internal Azure engineering teams were independently building custom grouping solutions, creating fragmentation across the platform. We needed a unified, extensible solution that could serve both customer demands and internal partner needs.
My Role
As the lead PM, I was responsible for:
Product Strategy: Defining the next-generation grouping model for Azure
Cross-Team Alignment: Orchestrating a roadmap across 12+ partner engineering teams
Architecture Decisions: Shaping how links, membership, and relationships would work
Delivery: Driving the feature from concept through public release under tight deadlines
The Solution
We introduced Azure Service Groups, a new platform primitive that supports:
Graph-Based Relationships: Many-to-many links between resources, groups, and services
Dynamic Memberships: Rule-based logic for automatically updating group contents
Extensible Design: A shared, persisted relationship model usable by all Azure services
To support this, I worked with engineering to build a robust linking mechanism, using persisted metadata rather than ephemeral queries. We scoped dynamic rules for future iterations while focusing the MVP on persisted links to accelerate adoption.
I also defined six guiding product principles—covering scale, performance, governance, and extensibility—which served as alignment tools for all partner teams.
Execution Highlights
Partner Collaboration: Engaged 12+ Azure teams including Identity, Compute, Networking, and Security to adopt the Service Group platform
Engineering Negotiations: When a key partner (Identity) lacked capacity, I brokered a deal to embed one of our principal engineers into their codebase, saving six months of delay
Deadline Focus: Established daily syncs, backlog forecasting, and stakeholder dashboards to meet an aggressive Q4 production readiness deadline, ahead of Azure’s holiday deployment freeze
Results
Launched in early 2025 with documentation, partner onboarding, and Microsoft Build coverage
Adoption: Partner services began actively integrating SGs into their customer experiences
Impact: Internal analysis surfaced over 2 million relationships across Azure services in just the initial inventory phase—highlighting the value and need for graph-based governance
Strategic Foundation: Positioned Service Groups as the future of Azure resource modeling, policy evaluation, and compliance mapping
Reflection
Service Groups was one of the most ambitious and rewarding initiatives of my time at Microsoft. It combined deep platform strategy, technical design, and cross-organizational leadership—pushing Azure toward a more flexible and intelligent governance model. Although my tenure was cut short by broader organizational restructuring, the project’s success and early traction underscored the long-term value of the investment.
Additional images and concepts
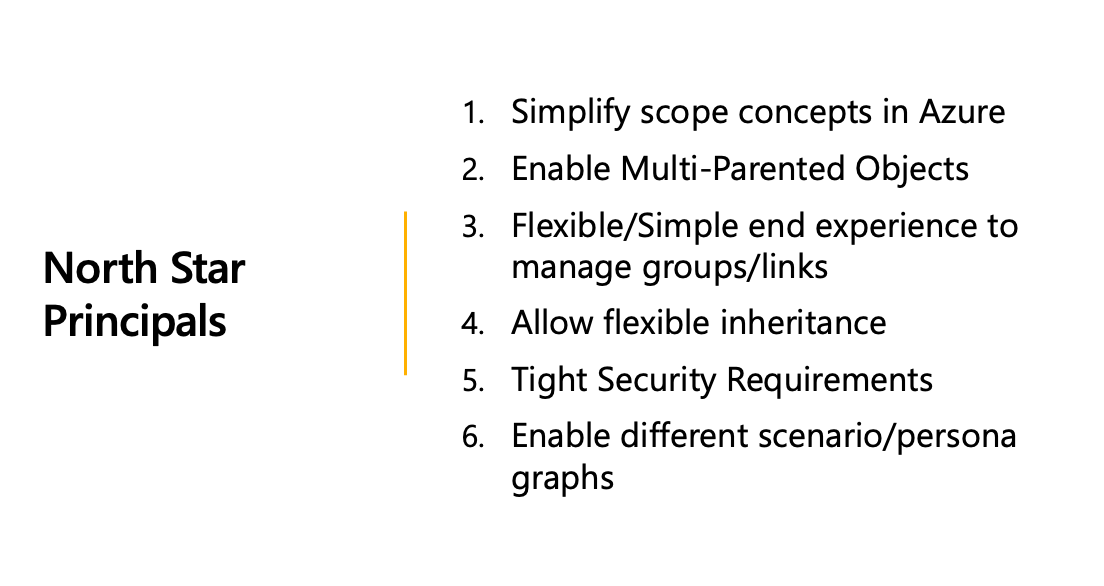
Northstar vision I created to help with decision making
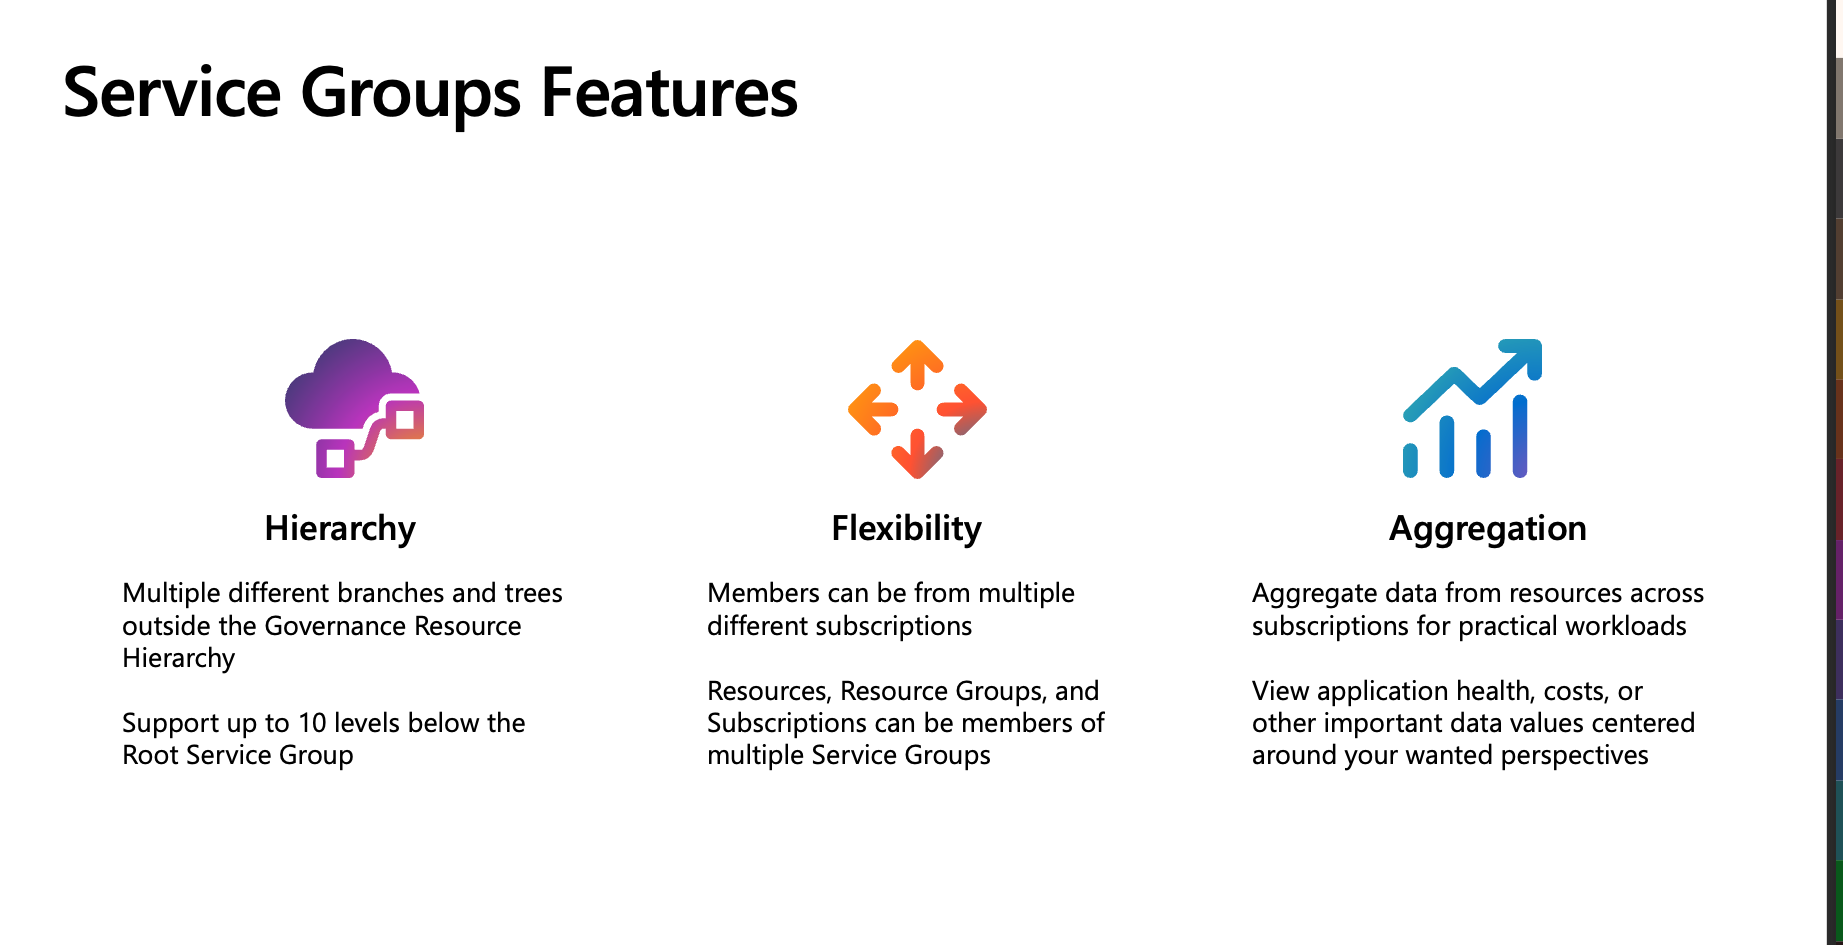
Basic features that were planned early on

Model I created to show how the nesting works in the resource hierarchy
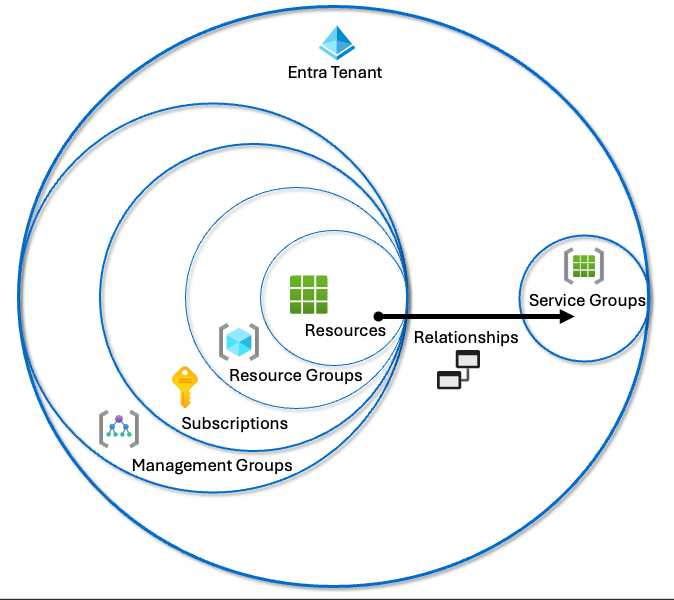
Model I created to show how service groups relate to the normal hierarchy

Early vision on how services are related via the resources
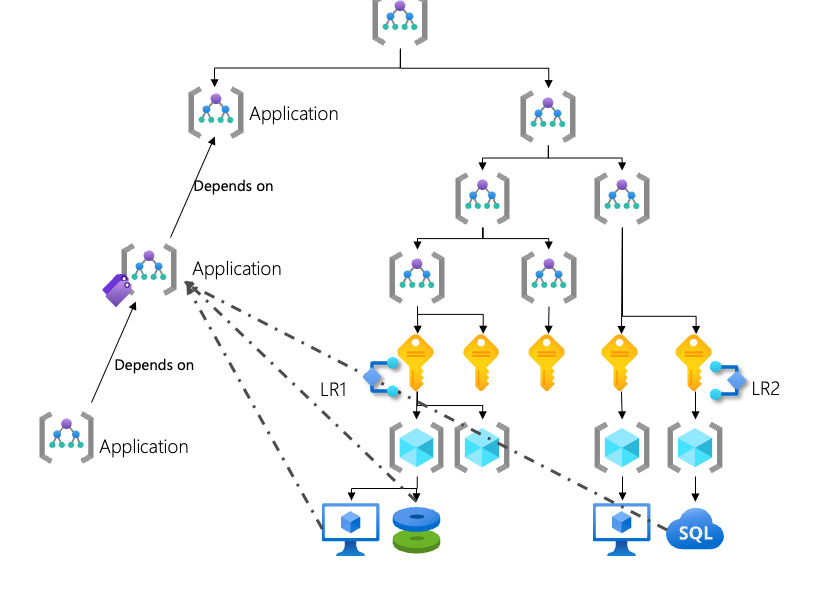
Early diagram showing how multiple resources connect to an application that has links to other applications

This diagram shows how two objects with their details are linked via a relationship

Early model showing the scoping feature of a LDR that would allow connecting a set of resources to an new or existing group.

Final view used to show how the relationships connect the same resources to the service groups
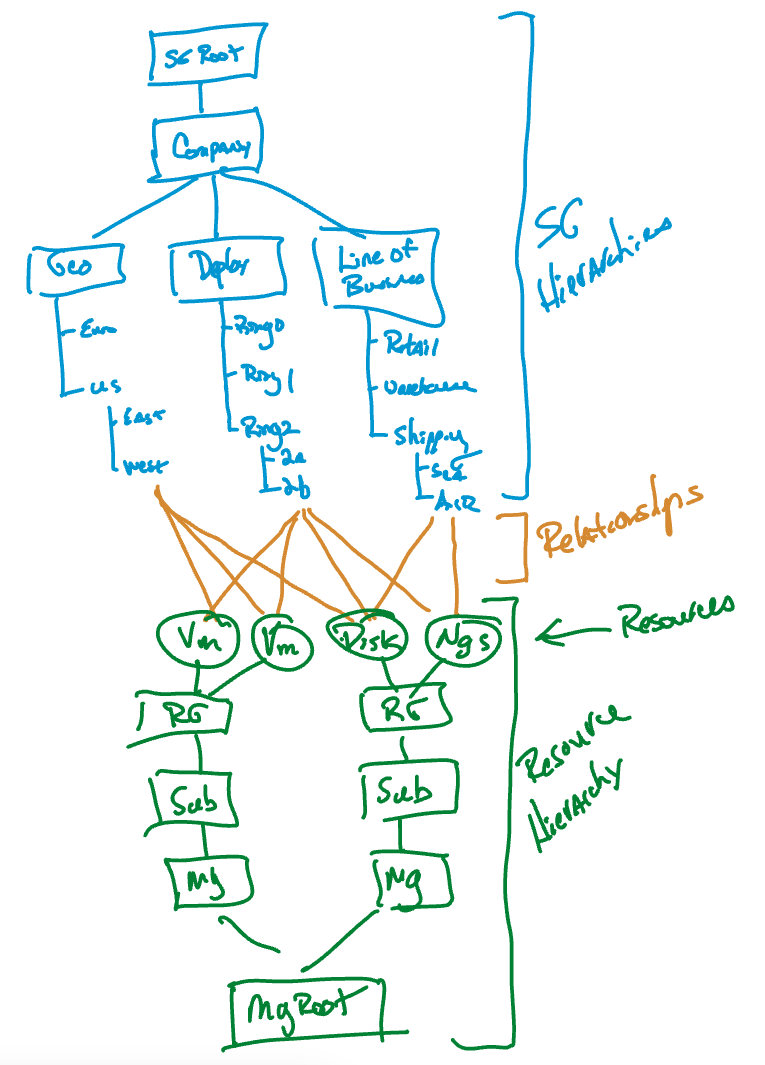
Early drawing of mine showing how the resources in the middle are connected to different "sides" or hierarchies

The projections of when the team was likely to finish based on current velocity and remaining work in Oct. I would update this chart daily and send it out daily/weekly to stakeholders.
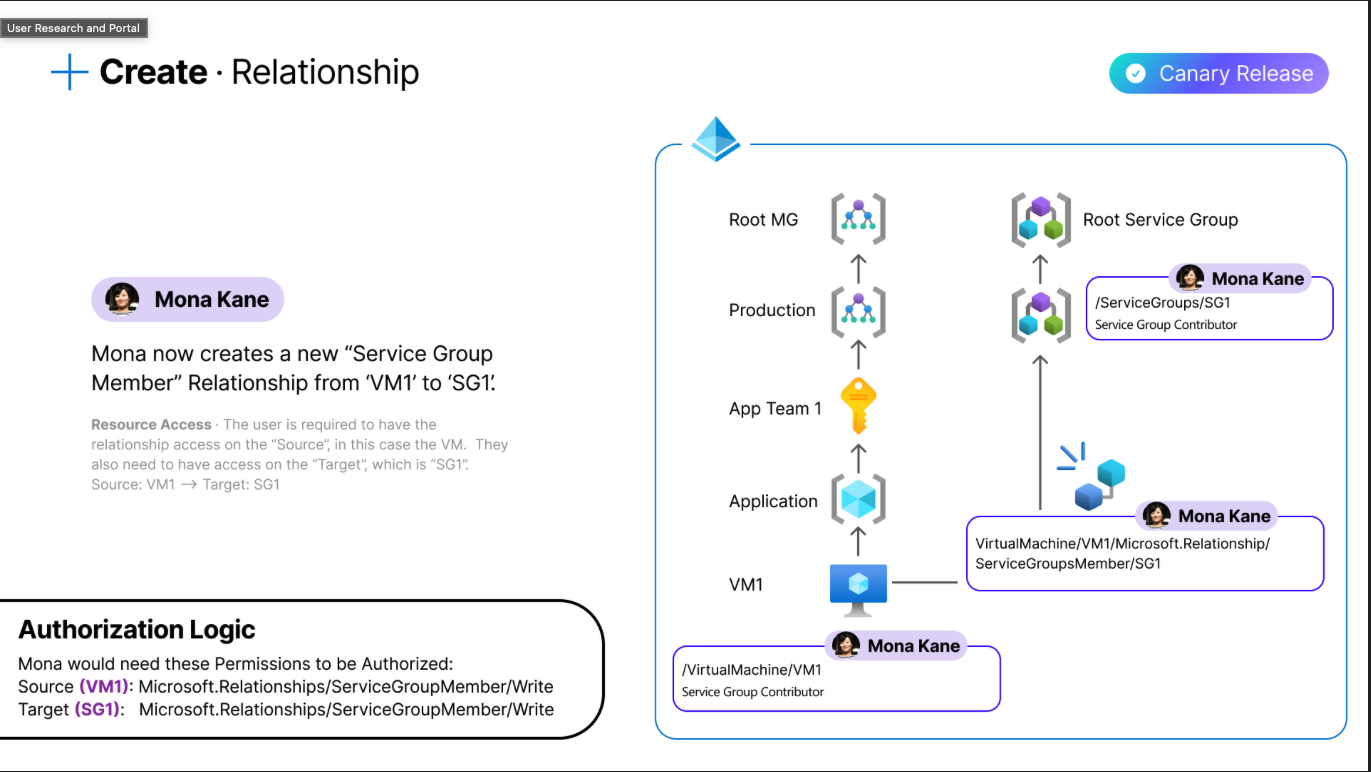
This model was part of a larger RBAC slideshow that walked personas through access controls

UI Mock up of what the Azure portal browse pages could look and what they are envisioned to include

Later mock up that has a graph view of the actual objects related to each other to visually explain relationships

Azure portal UI customer journey map I created to explain how customers intend to move through the UI
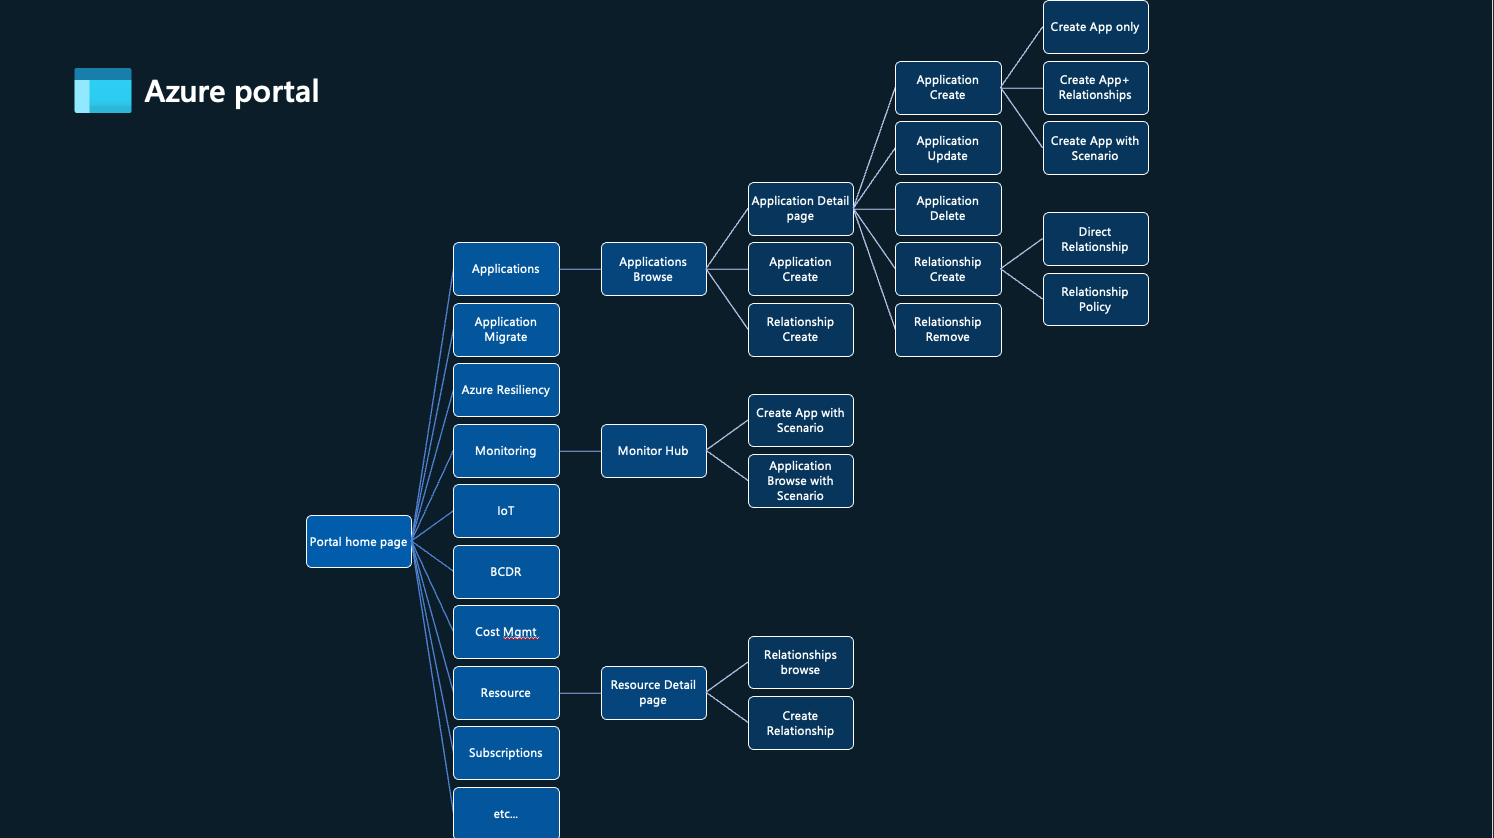
Azure portal mapping of pages connected and how a user would move through the pages. I created this in the early UI talks to help give context to designers

Mock up of the detailed Service Group page envisioned with multiple cards

What the Azure portal could look like if the design focused in on scenarios customers were looking at doing instead of selecting the resources only. My goal was to simplify customer journey and shortcut them to to their final goal
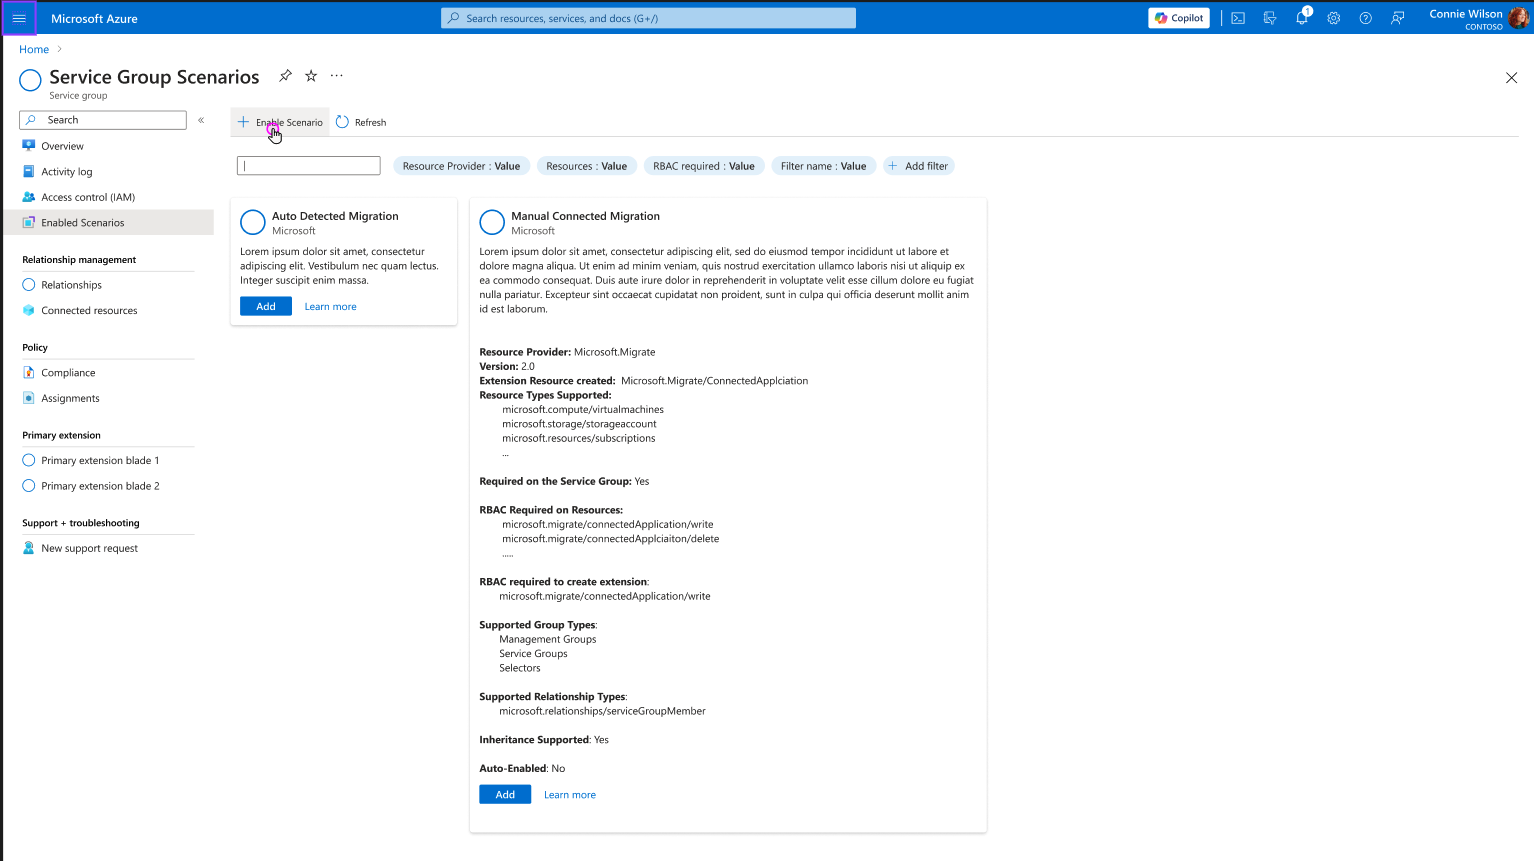
Concept of what the portal could look like if the scenarios were the focus for selection instead of requiring the customer know the multiple resources needed.
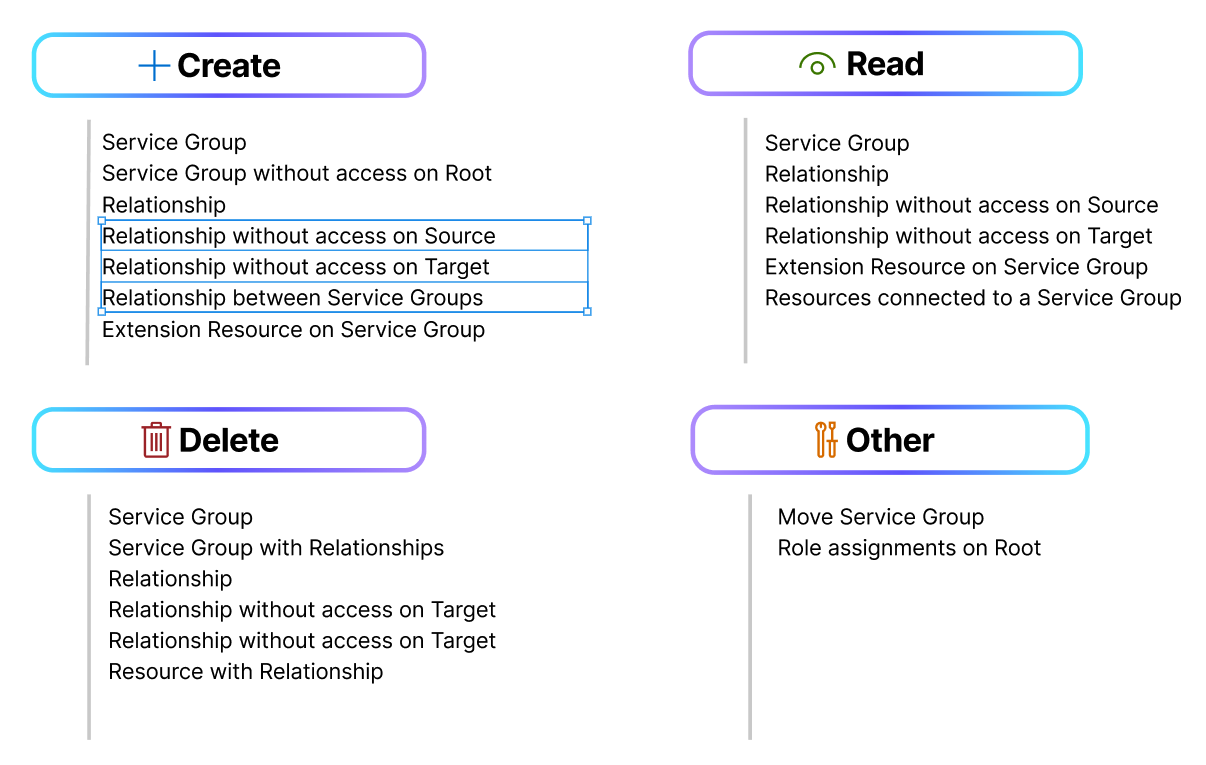
List of scenarios by action used to show MVP plans
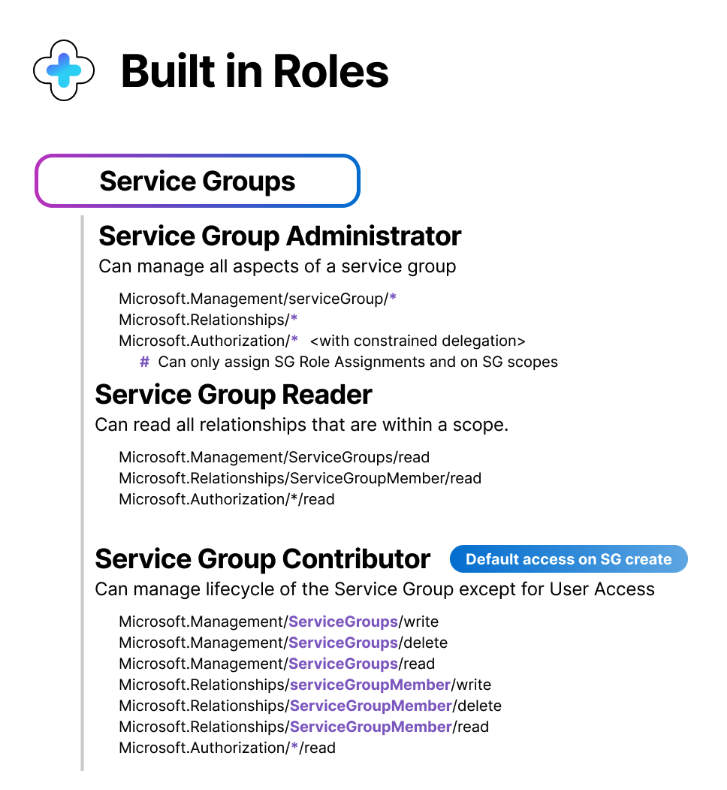
Azure built-in roles planned to be released at initial preview
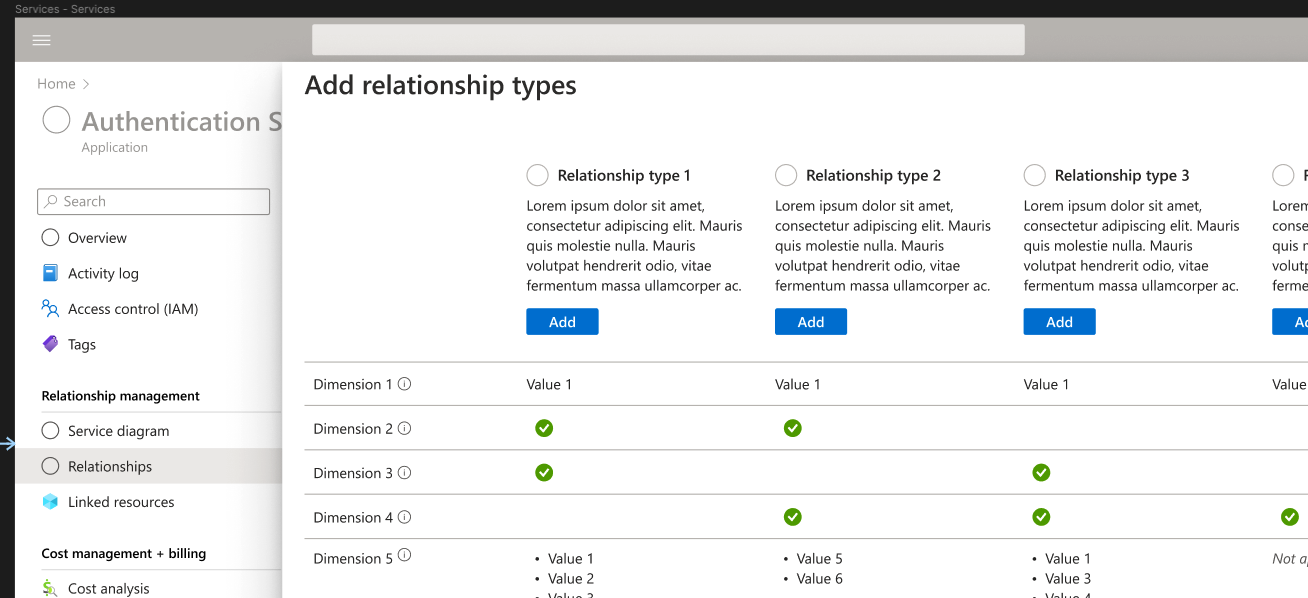
Early mock up of the portal view where many relationships could be shown to the customer to choose from. We decided to simplify this and only have minimal relationship types
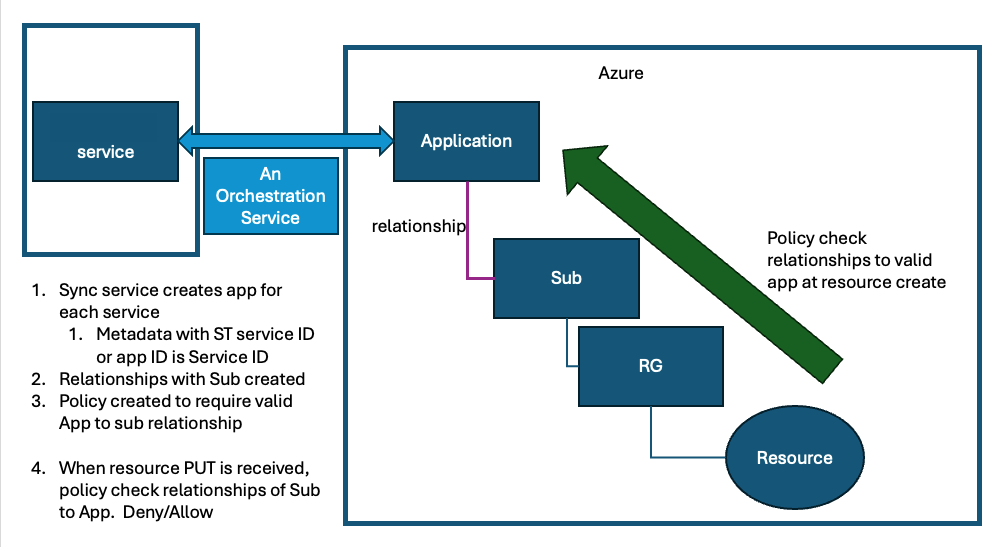
Diagram showing the orchestration service being used to sync and connect Azure and internal systems
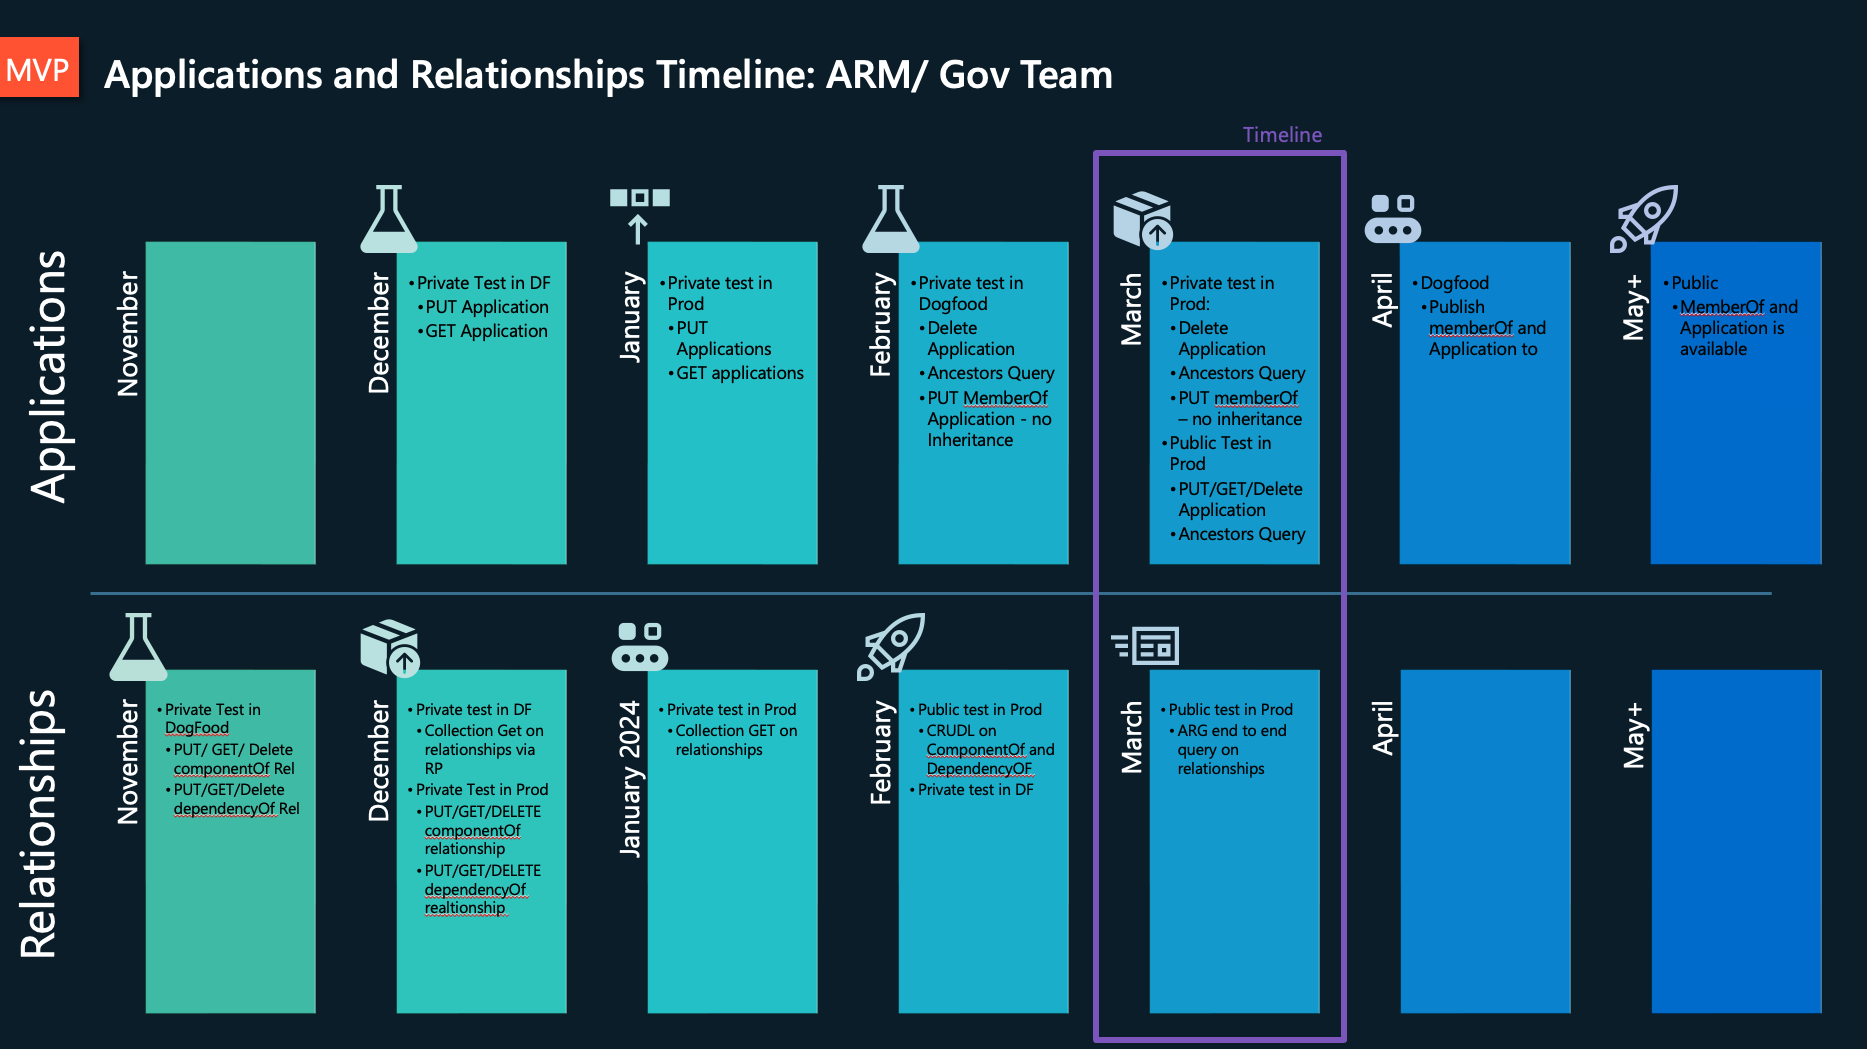
Example timeline used in communications to stakeholders on progress and projections.

Very early wireframe I did to show how I envisioned a customer would view the relationships at the resource level.

Simple diagram showing how to move a SG from one parent to another.
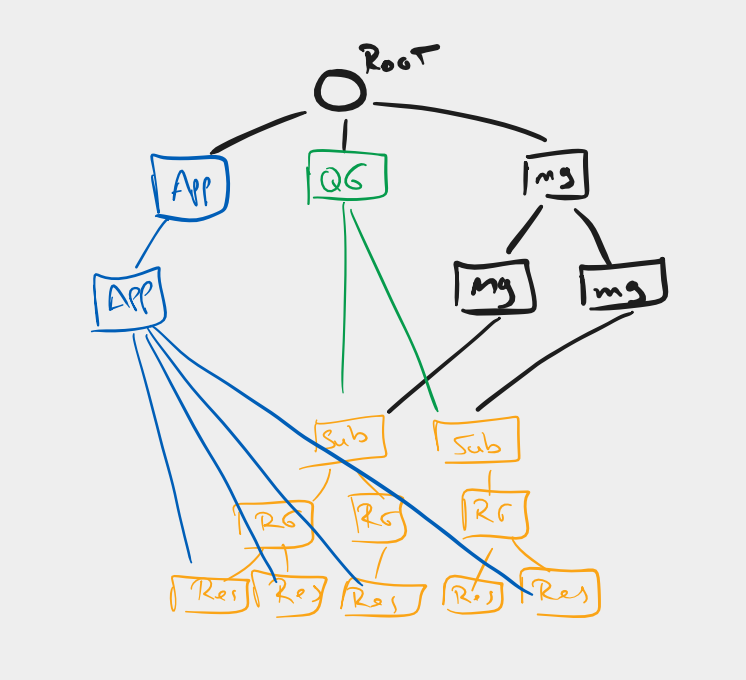
Early drawing used to explain how one root can have multiple branches even if they are different types of groupings

A view showing how the different objects would be connected with relationships
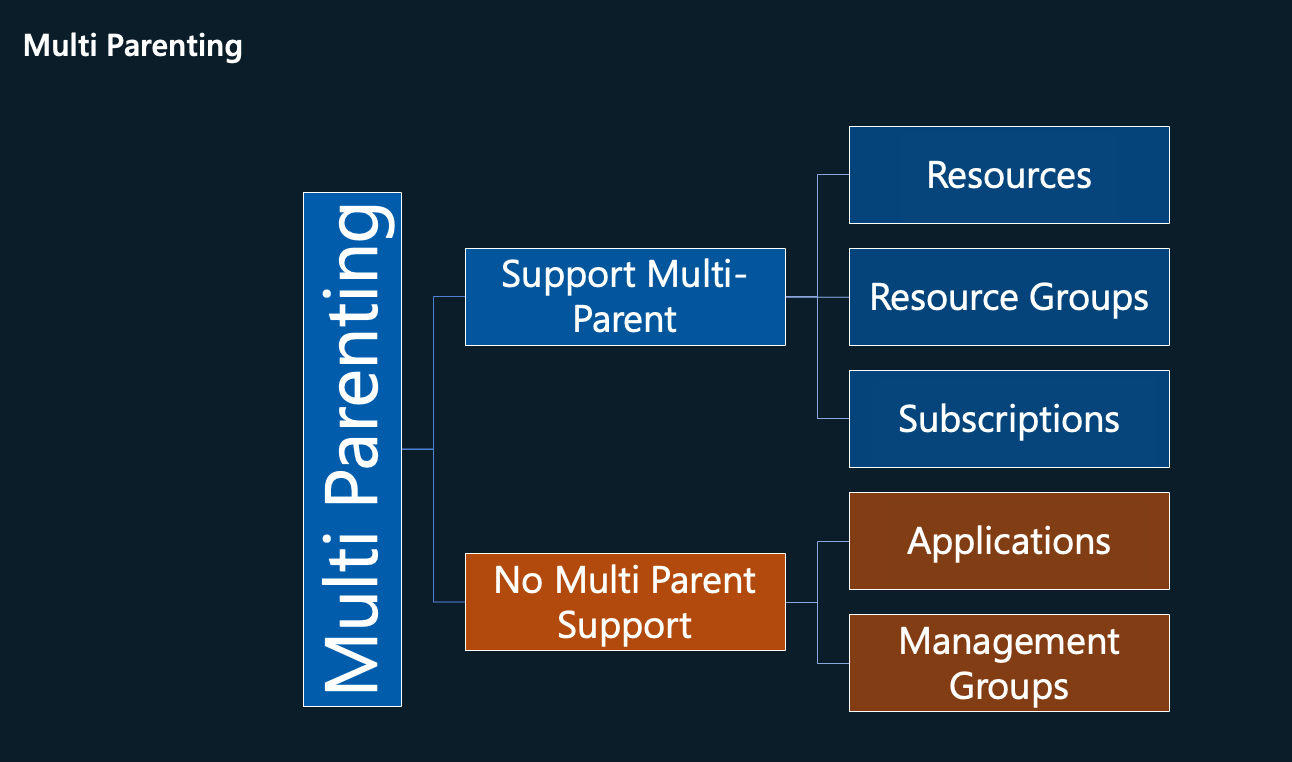
Diagram used to explain to customers and teams that applications (renamed Service Groups) and MGs would not support multi parenting, but the other resources would.

Simple diagram I used to explain that a relationship should be not be owned by one side only. The relationship should have joint ownership and can be cut by either side at any point
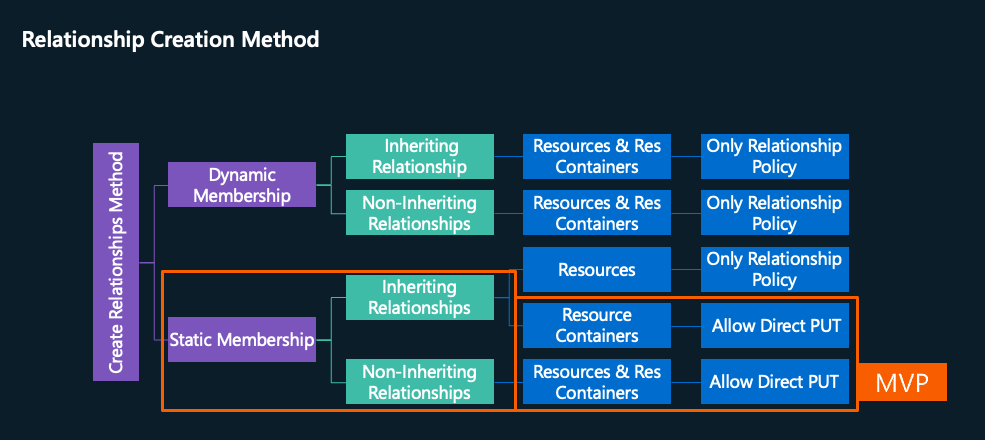
Feature diagram used in communications to show what MVP would include after moving Dynamic Memberships out to a later release.

expanded view showing multiple branches and how parenting could not happen (red line) across branch borders.

Visually complex, but simple to explain how each application has its own set of resources and management group connections, but the applciations to the left dependong on the services in the middle, which also have dependencies on the infra on the right. This was used in conversations about the complexity of hte graph
This was an early prototype LDR icon I used in material

Potential Service Group design suggested

Potential Service Group Icon Design
Variations I created for the relationship icon
This was the design team options in a round of icon generation. My feedback was the bottom item look to close to Google icons, and the top didn't actually have any elements of the graph
A set of options I created based on the Box icon to see if any stood out as winners. None were.
Larger set of icons I created to see if it was the color options or the icon not liked.
I created this concept using dots instead of the boxes, closer to Management Groups Icon
I used copilot designer to help draft ideas on icons
I used copilot designer to help draft ideas on icons
I used copilot designer to help draft ideas on icons
I used copilot designer to help draft ideas on icons
A brainstorming set of icons I created to see if anyone clicked as the optimal choice. The second icon in the second row would eventually lead to the final icon used.
Close up of the box icon concept

Once I and my teammate Kemley agreed on the design, we tried color options to see what worked.

An option I personally really liked showing the idea of one resource (the box) and a connected string.

This chart was used to explain how MGs were on the more restrictive axis while tags focused on non-restrictive and simple axis. I mapped relationships into this for targeting and vision